
The Bitcoin fee market is like a real time congestion map for the world’s most secure blockchain. Every time you see a spike in transaction costs, it’s not random. It’s a signal that blocks are full, the mempool is growing, and users are bidding for limited space. For crypto analysts and investors in 2026, reading these signals is critical. Fees aren’t just an expense. They are a window into network health, adoption trends, and even future price movements. So, what exactly does the fee market reveal about Bitcoin network congestion this year? And how can you use that data to make smarter decisions?
Bitcoin’s fee market in 2026 offers a clear lens on network congestion. High fees mean full blocks and heavy mempool demand. By tracking fee metrics, you can predict congestion periods, plan transactions around off-peak times, and avoid overpaying. This guide breaks down the key indicators every analyst needs to watch.
What the Bitcoin Fee Market Actually Measures
The fee market is the sum of all fees users pay to get their transactions confirmed. But it’s not just a single number. It reflects supply and demand for block space. When demand is low, fees drop. When demand surges, fees climb. The most important metric is the “fee rate” measured in satoshis per virtual byte (sat/vB). This rate tells you how much you need to pay for your transaction to be included in the next block.
In 2026, the average block size remains capped at 4 million weight units (WU). That is roughly 1 to 1.5 MB of actual transaction data. With more adoption and new use cases like Ordinals and Runes, block space is scarcer than ever. The fee market becomes a bidding war. Analysts watch the fee rate distribution across the mempool to gauge how desperate users are.
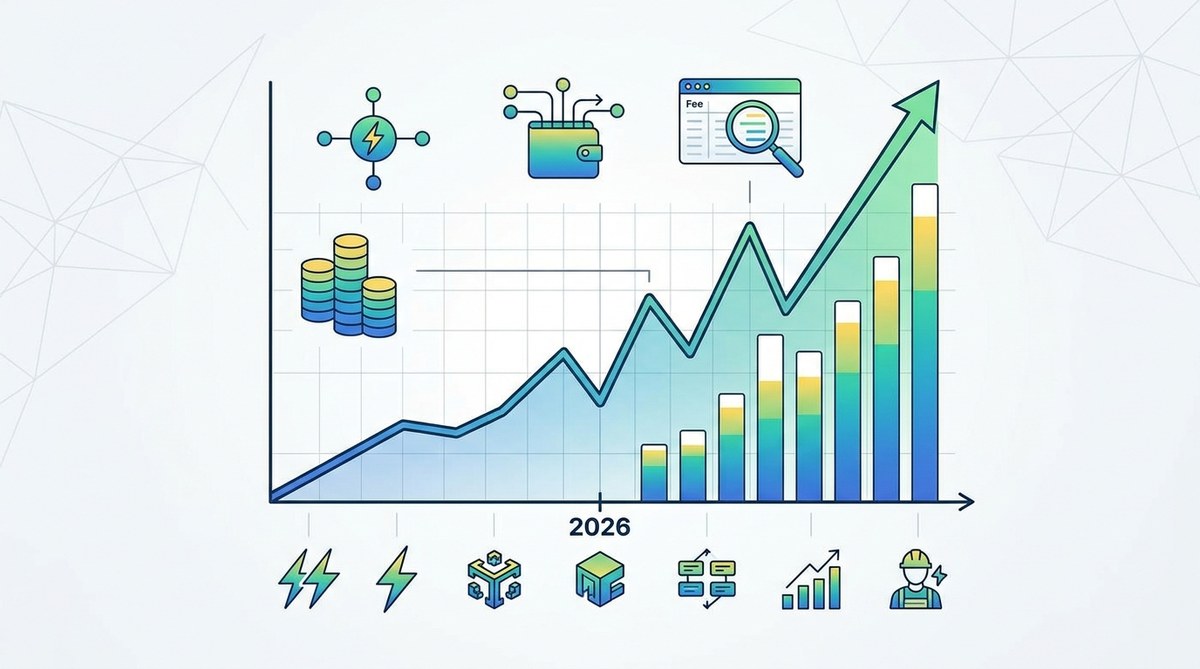
Why 2026 Is a Pivotal Year for Network Congestion
Several factors make this year unique. The fourth Bitcoin halving happened in April 2024, cutting block rewards from 6.25 BTC to 3.125 BTC. By 2026, miner revenue from fees has become a larger share of total income. This shifts the economic incentives. Miners now prioritize high fee transactions during congestion. Meanwhile, institutional adoption through spot ETFs and corporate treasuries keeps demand steady. Layer 2 solutions like Lightning Network are growing, but on chain settlements still spike during market volatility.
Additionally, the rise of Bitcoin based token protocols (Ordinals, BRC 20, Runes) adds constant pressure. These protocols generate a steady stream of inscription transactions that fill blocks even during quiet price action. The result is a new baseline: fees rarely drop to the sub 10 sat/vB levels seen before 2023. Understanding this new normal is essential for predicting future congestion.
How to Read the Fee Market for Congestion Signals
Here is a practical process analysts use to interpret the fee market and anticipate congestion:
-
Check the mempool backlog. Tools like mempool.space show the number of unconfirmed transactions. A backlog of over 200,000 transactions usually indicates high congestion. Watch the total size in vB, not just the count.
-
Look at fee rate percentiles. The median fee rate (50th percentile) is a good baseline. If the 25th percentile is above 20 sat/vB, the network is busy. The 90th percentile tells you what urgency costs. Spikes in the 90th percentile suggest a sudden demand surge.
-
Compare fee revenue to block reward. When fee revenue exceeds the block subsidy (3.125 BTC per block), miners have a strong incentive to keep confirming. This signals that the network’s security budget is becoming fee dependent, a long term bullish sign for sustainability but also a sign of sustained congestion.
These three steps give you a snapshot of current pressure. Combine them with historical data to spot trends.
Key Factors Driving Fees in 2026
- Ordinals and Runes adoption: Inscription volume has stabilized at around 50 100 MB per day. This permanently fills a portion of each block.
- ETF creation and redemption: Large institutional movements create sudden demand for on chain settlement, especially during rebalancing periods.
- Wallet consolidation activity: Exchanges and whales batch transactions, but not always. High value sweeps push fees up.
- Global economic events: News about inflation, regulation, or banking crises often triggers a rush to self custody.
- Miner fee policies: Some mining pools now run fee optimization algorithms that auction block space dynamically.
What the Numbers Tell Us: A Look at the Data
The table below compares key fee metrics during typical low congestion versus high congestion periods in 2026.
| Metric | Low Congestion (Weekend) | High Congestion (ETF Launch Day) |
|---|---|---|
| Median fee rate | 8 12 sat/vB | 80 150 sat/vB |
| Mempool size | 20 MB | 250 MB |
| Wait time for low fee | 30 minutes | 6 hours+ |
| Fee share of block reward | 15% | 60%+ |
| Number of high fee transactions (>100 sat/vB) | <200 per hour | 5,000+ per hour |
These numbers show that congestion is not binary. It is a spectrum. Analysts can use fee rate bands to estimate how many transactions are competing for the next block. When the high fee band is crowded, you know the network is under stress.
“The fee market is the most honest indicator of Bitcoin’s real world utility. When fees rise, it means people are willing to pay for security and finality. In 2026, we see a mature network where congestion is not a bug but a feature of high demand.” Johnathan Masters, blockchain economist at CoinMetrics.
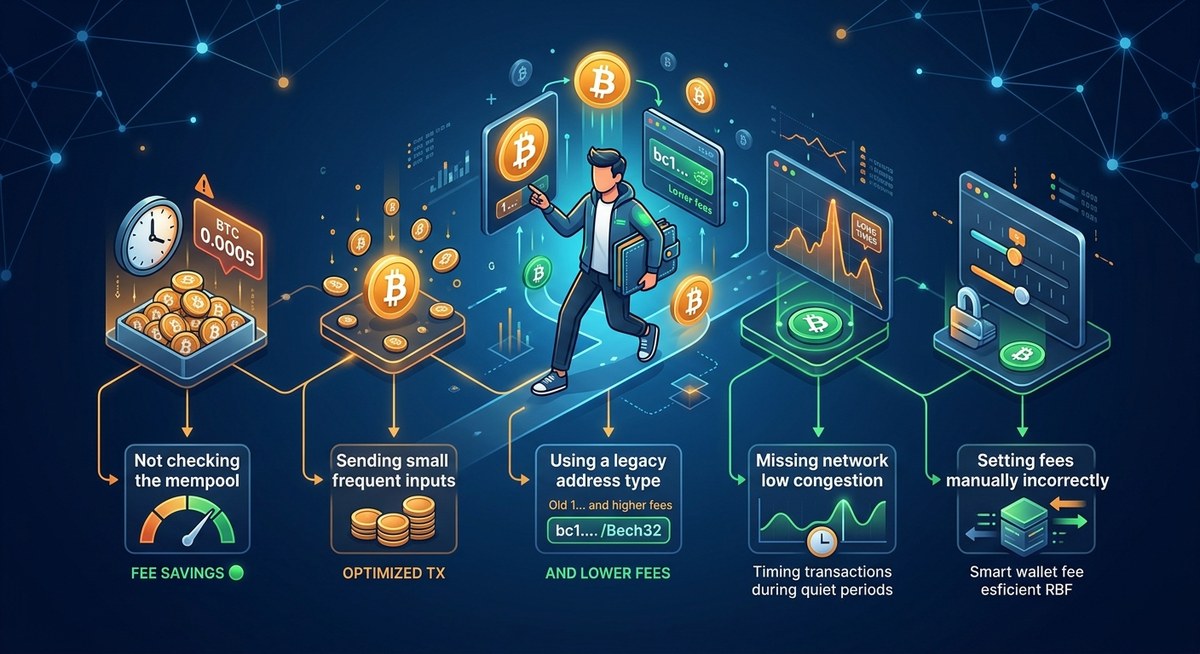
Practical Steps to Save on Fees During Congestion
You can use the fee market data to your advantage. Here are strategies that work in 2026:
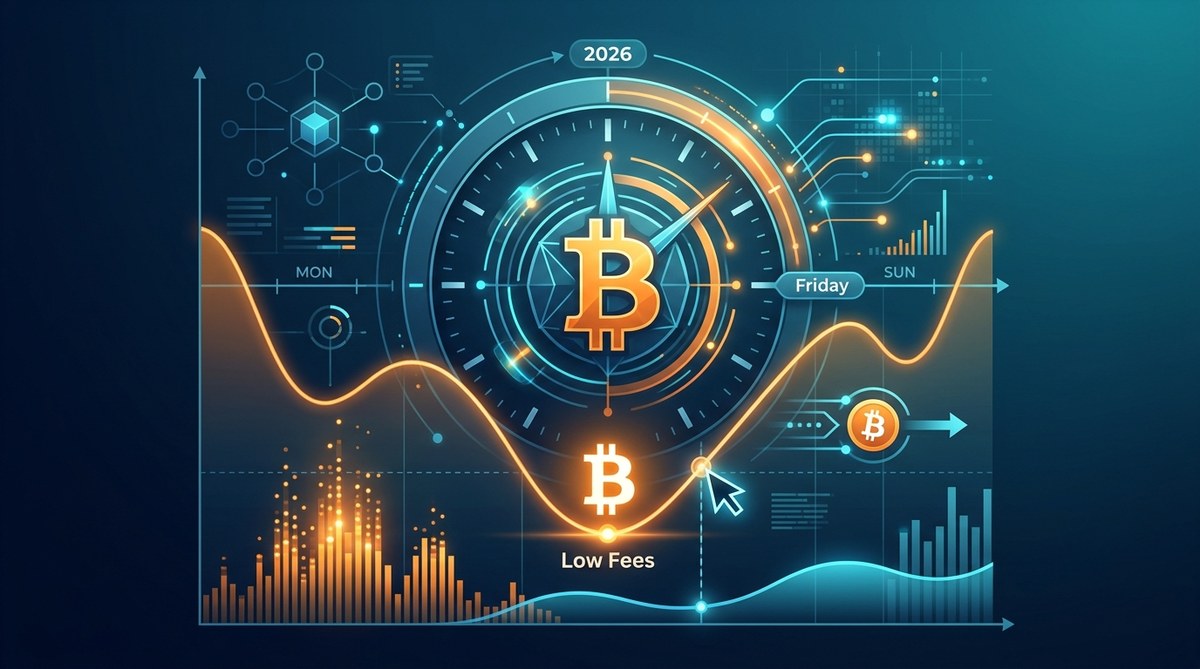
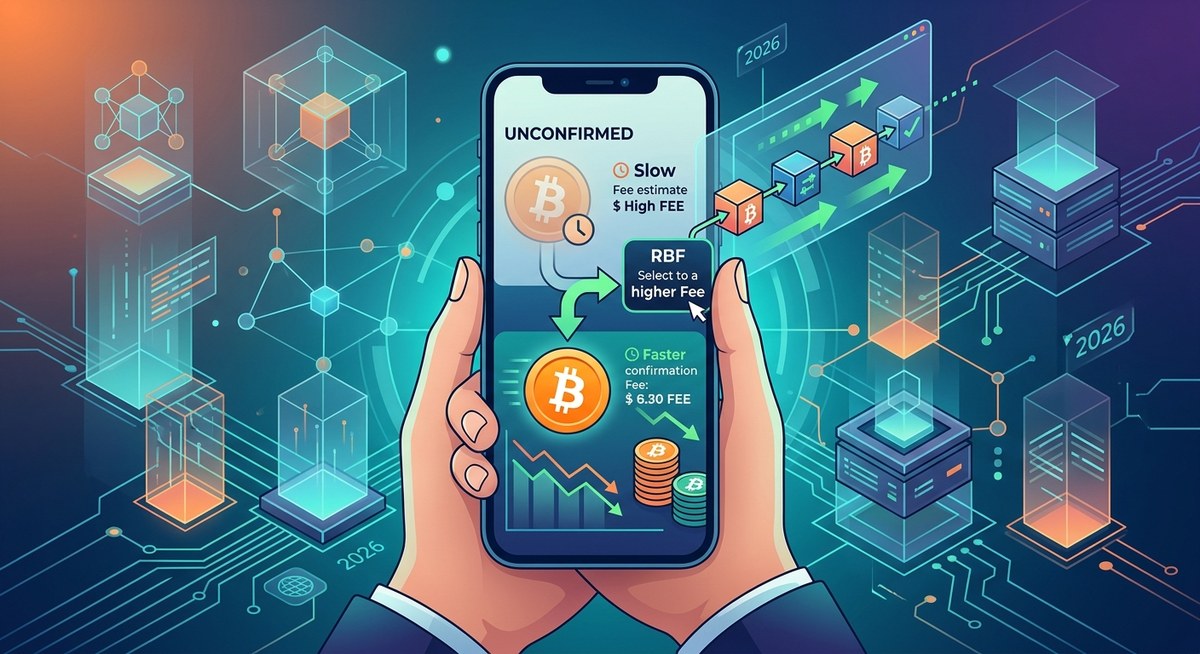
- Use a wallet with Replace by Fee (RBF) to start low and increase later if needed.
- Schedule non urgent transactions for weekends or early morning UTC.
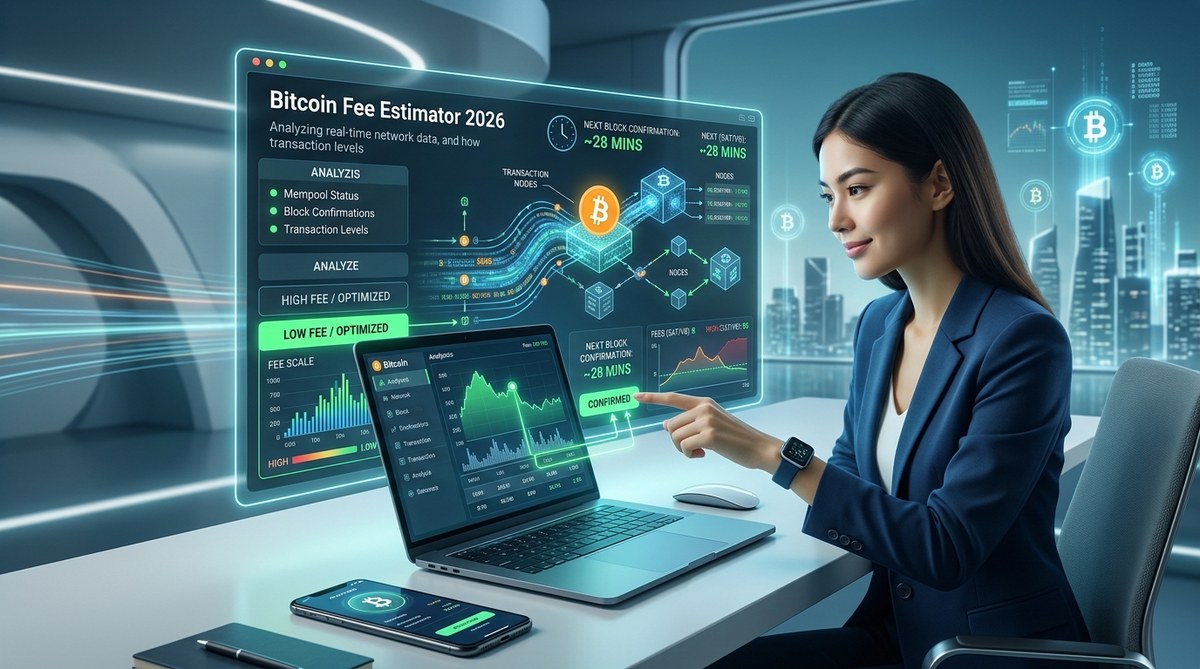
- Use a fee estimator that uses the mempool data, not a fixed multiplier.
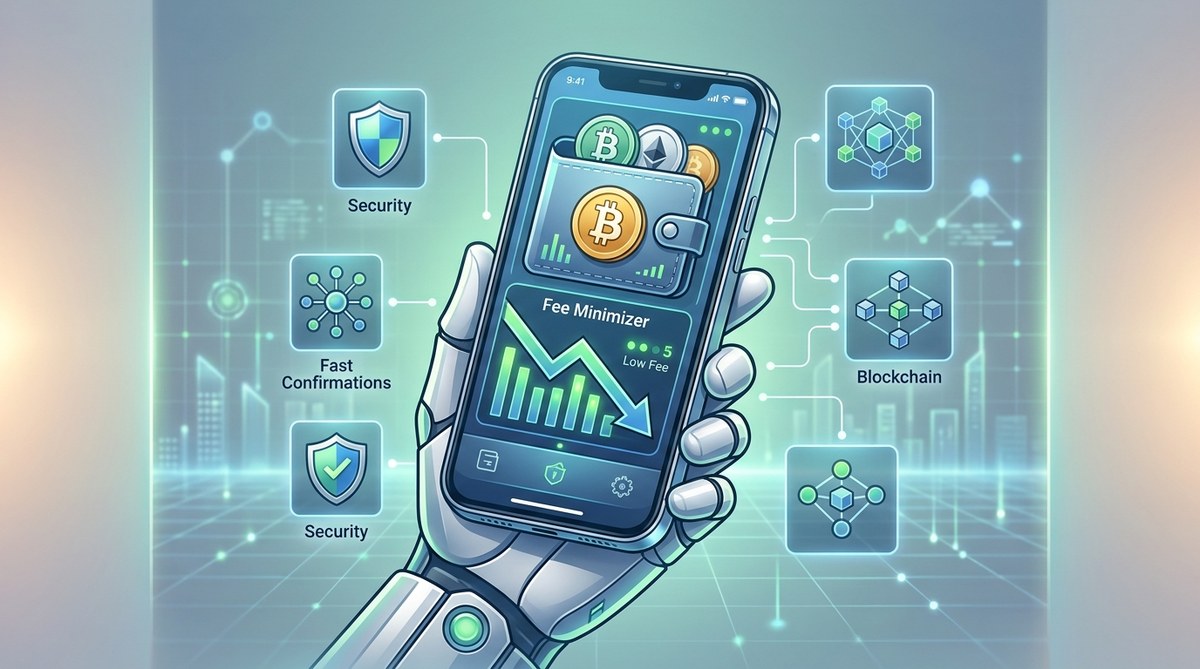
- Consider using top tools to track network performance and minimize transaction fees for real time alerts.
- For small value transfers, consider a layer 2 solution like Lightning or even Bitcoin Cash for lower fees. Learn more about why Bitcoin Cash offers lower fees for everyday transactions.
A numbered process for timing your on chain transaction:
- Open a mempool visualizer and note the current fee rate for fast confirmation.
- Set a custom fee slightly above the 25th percentile to get in the next few blocks.
- If the mempool is growing, wait until it shrinks. Use historical patterns to guess the lull.
- If you must send immediately, use the 90th percentile rate to ensure inclusion.
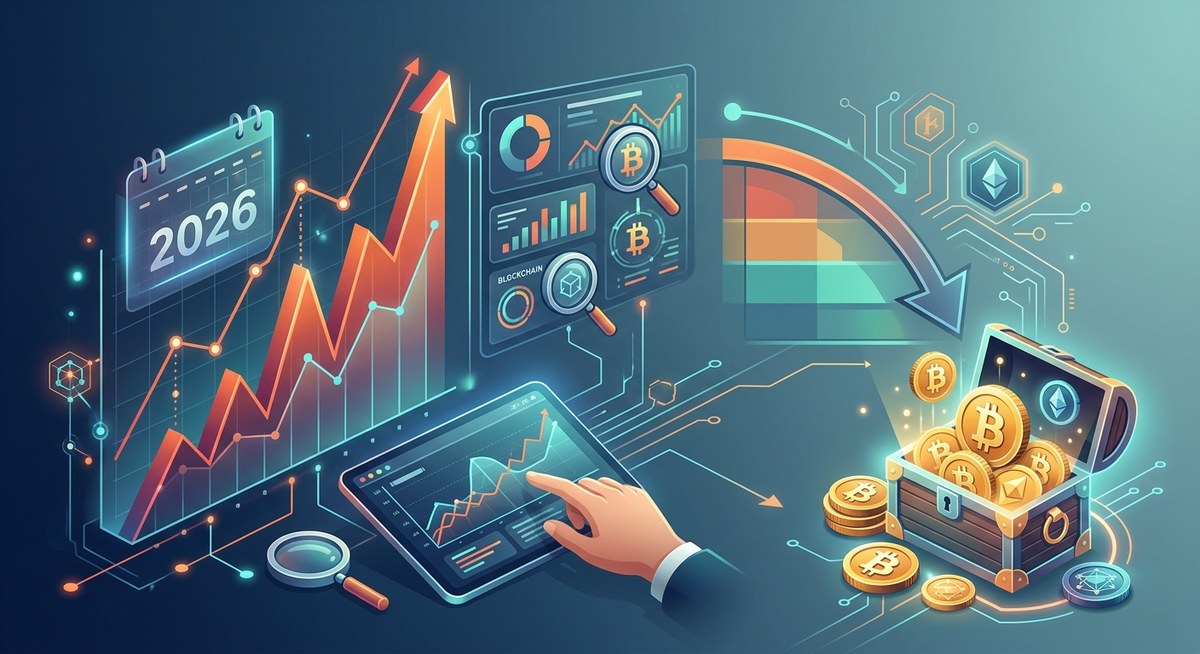
Reading the Fee Market as a Long Term Signal
Beyond immediate savings, the fee market helps you assess network health. Persistent high fees indicate strong demand for block space. That is bullish for Bitcoin’s value as a settlement layer. But it also highlights the need for scaling. As an analyst, you can track the ratio of fee revenue to total miner revenue. If that ratio stays above 30% for months, the network is transitioning to a fee based security model. This is a sign of maturity, not crisis.
Investors should also watch for fee spikes that accompany price movements. A sudden fee surge before a price rally often signals accumulation by large holders moving coins to cold storage. Conversely, falling fees during a price drop may indicate a loss of interest.
To stay ahead, combine fee data with on chain metrics like active addresses and transaction count. Tools that help you analyze blockchain data for better cryptocurrency investments are invaluable. You can also master Bitcoin network fees to save money on transactions by understanding these patterns.
The fee market is not just a pain point. It is a rich data source for anyone serious about Bitcoin. In 2026, it tells us that the network is more congested than ever, but that congestion is driven by genuine demand. By learning to read the signals, you can save money, time, and gain insight into where Bitcoin is headed. Next time you see a fee spike, do not just complain. Ask yourself: what is the network telling me?


Leave a Reply